Character Count
Overview
The Character Count widget provides a detailed breakdown of the character composition of column values in a dataset. It helps users understand whether column values contain letters, numbers, special characters, or combinations, enabling validation of data formats and detection of inconsistent or unexpected character patterns.
What the Widget Analyzes
-
Profiling dimension: Character-level composition of column values
-
Level of analysis: Column-level
-
Calculation basis:
-
Counts are derived from analyzing the characters present in each record value of a column
-
Results are aggregated to show how many records fall into each character category
-
What the Widget Shows
-
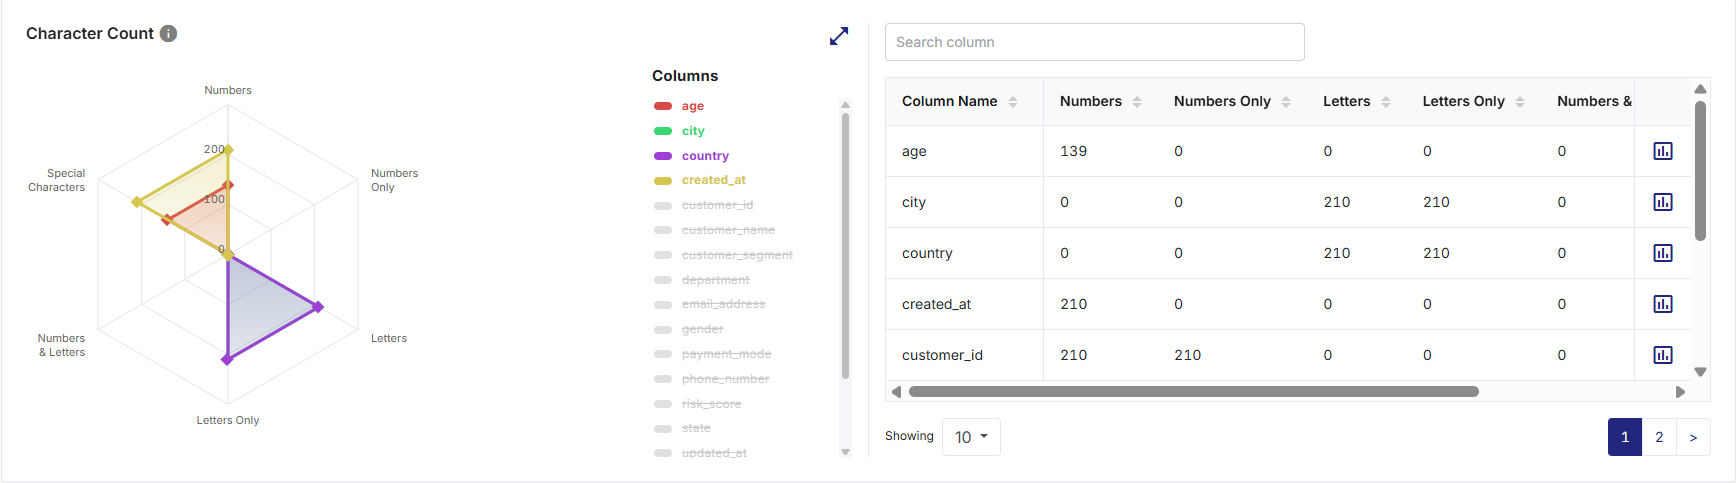
A visual comparison of character composition across selected columns using a radar-style spider chart.
-
Record counts for different character categories per column.
-
A tabular summary showing exact counts for each character category.
-
The ability to switch focus between columns for detailed analysis. Column-level indicators display distribution details (Character count for current vs. average of last 5 runs) for individual columns.
How to Read This Widget
-
Each axis on the chart represents a character category such as Letters, Letters Only, Numbers, Numbers Only, Numbers & Letters, and Special Characters
-
Each plotted shape represents a column, distinguished by color.
-
The distance from the center indicates the record count for that category.
-
Higher values indicate stronger presence of that character type in the column.
-
The legends on the widget map colors to their respective metrics for each column and the spider chart updates the character category axes based on the legend selection.
Available Views
The widget supports a radar-style spider chart view. The legends on the right side of this spider chart identify which color corresponds to which column. Inactive columns appear greyed out and struck through when not selected.
On the top-right corner of the visualization pane, use the:
-
Expand icon to visualize a larger view of the character composition chart for improved visibility
-
Collapse icon to restore the widget to its default size

Note:
-
Hovering over chart points highlights the selected column and category.
-
Clicking the legend on the right side of the chart allows one of the following:
-
Enables that specific column and highlights its corresponding shape in the spider chart view.
-
Disables that specific column and hides its corresponding shape in the spider chart view.
-
-
All interactions are read-only and do not alter the dataset.
Supporting Panes
The widget includes a Character Count tabular summary pane on the right, always visible alongside the visualization pane on the left, providing detailed column-level context. It displays:
-
Column Name - Name of the dataset column
-
Numbers - Count of records containing numeric characters
-
Numbers Only - Count of records containing only numeric characters
-
Letters - Count of records containing alphabetic characters
-
Letters Only - Count of records containing only alphabetic characters
-
Numbers & Letters - Count of records containing a combination of numbers and letters
-
Special Characters - Count of records containing special characters
Note:
The spider chart provides a comparative view, while the table provides exact numeric values. Together, they allow both high-level pattern recognition and detailed validation.
Pane Interactions
-
Provide a column name in the Search column list box to filter columns in the table and quickly locate a specific column by name.
-
Click the download icon to export the result as PDF, CSV, or XLSX file. You can either download a consolidated file or individual widgets.
-
Download individual widgets to analyze specific visualizations in detail and gain deeper insights. Files are saved using a standard naming format by default, which you can rename locally after download:
<Data Profiler Results Widget name>_<Source Table name>.<pdf | csv | xlsx>
Example: CharacterCount_bronzepatientvisitdetails.csv
-
For consolidated Excel downloads, each widget is exported to a separate worksheet. For example, three widgets are saved as three sheets within a single Excel file.
-
-
Click on the column headers to sort columns in ascending or descending order.
-
Click the chart icon for each column to open the data distribution (Character count for current vs. average of last 5 runs) view for that specific column. This isolates and visualizes that specific column in the table highlighting its corresponding shape in the chart.
-
Scroll to access to additional columns or character categories when the list exceeds visible space.
How to Interpret the Results
-
High Letters Only counts indicate clean textual data.
-
High Numbers Only counts suggest numeric or identifier-style columns.
-
Presence of Numbers & Letters may indicate mixed-format fields.
-
Detection of Special Characters may highlight formatting issues or invalid data entries.
When to Use This Widget
-
To validate data format consistency across columns.
-
To detect columns with unexpected character patterns.
-
To support rule creation for format validation (for example, numeric-only or alphabet-only checks).
-
To identify data cleansing or standardization requirements.
 Recommended Topics Recommended Topics
|
What's next? Count |